Dissecting the Income Statement: Analyzing Revenue, Costs, and Operating Income Trends
Exploring revenue growth, gross profit, operating efficiency, and the red flags in a company's income statement
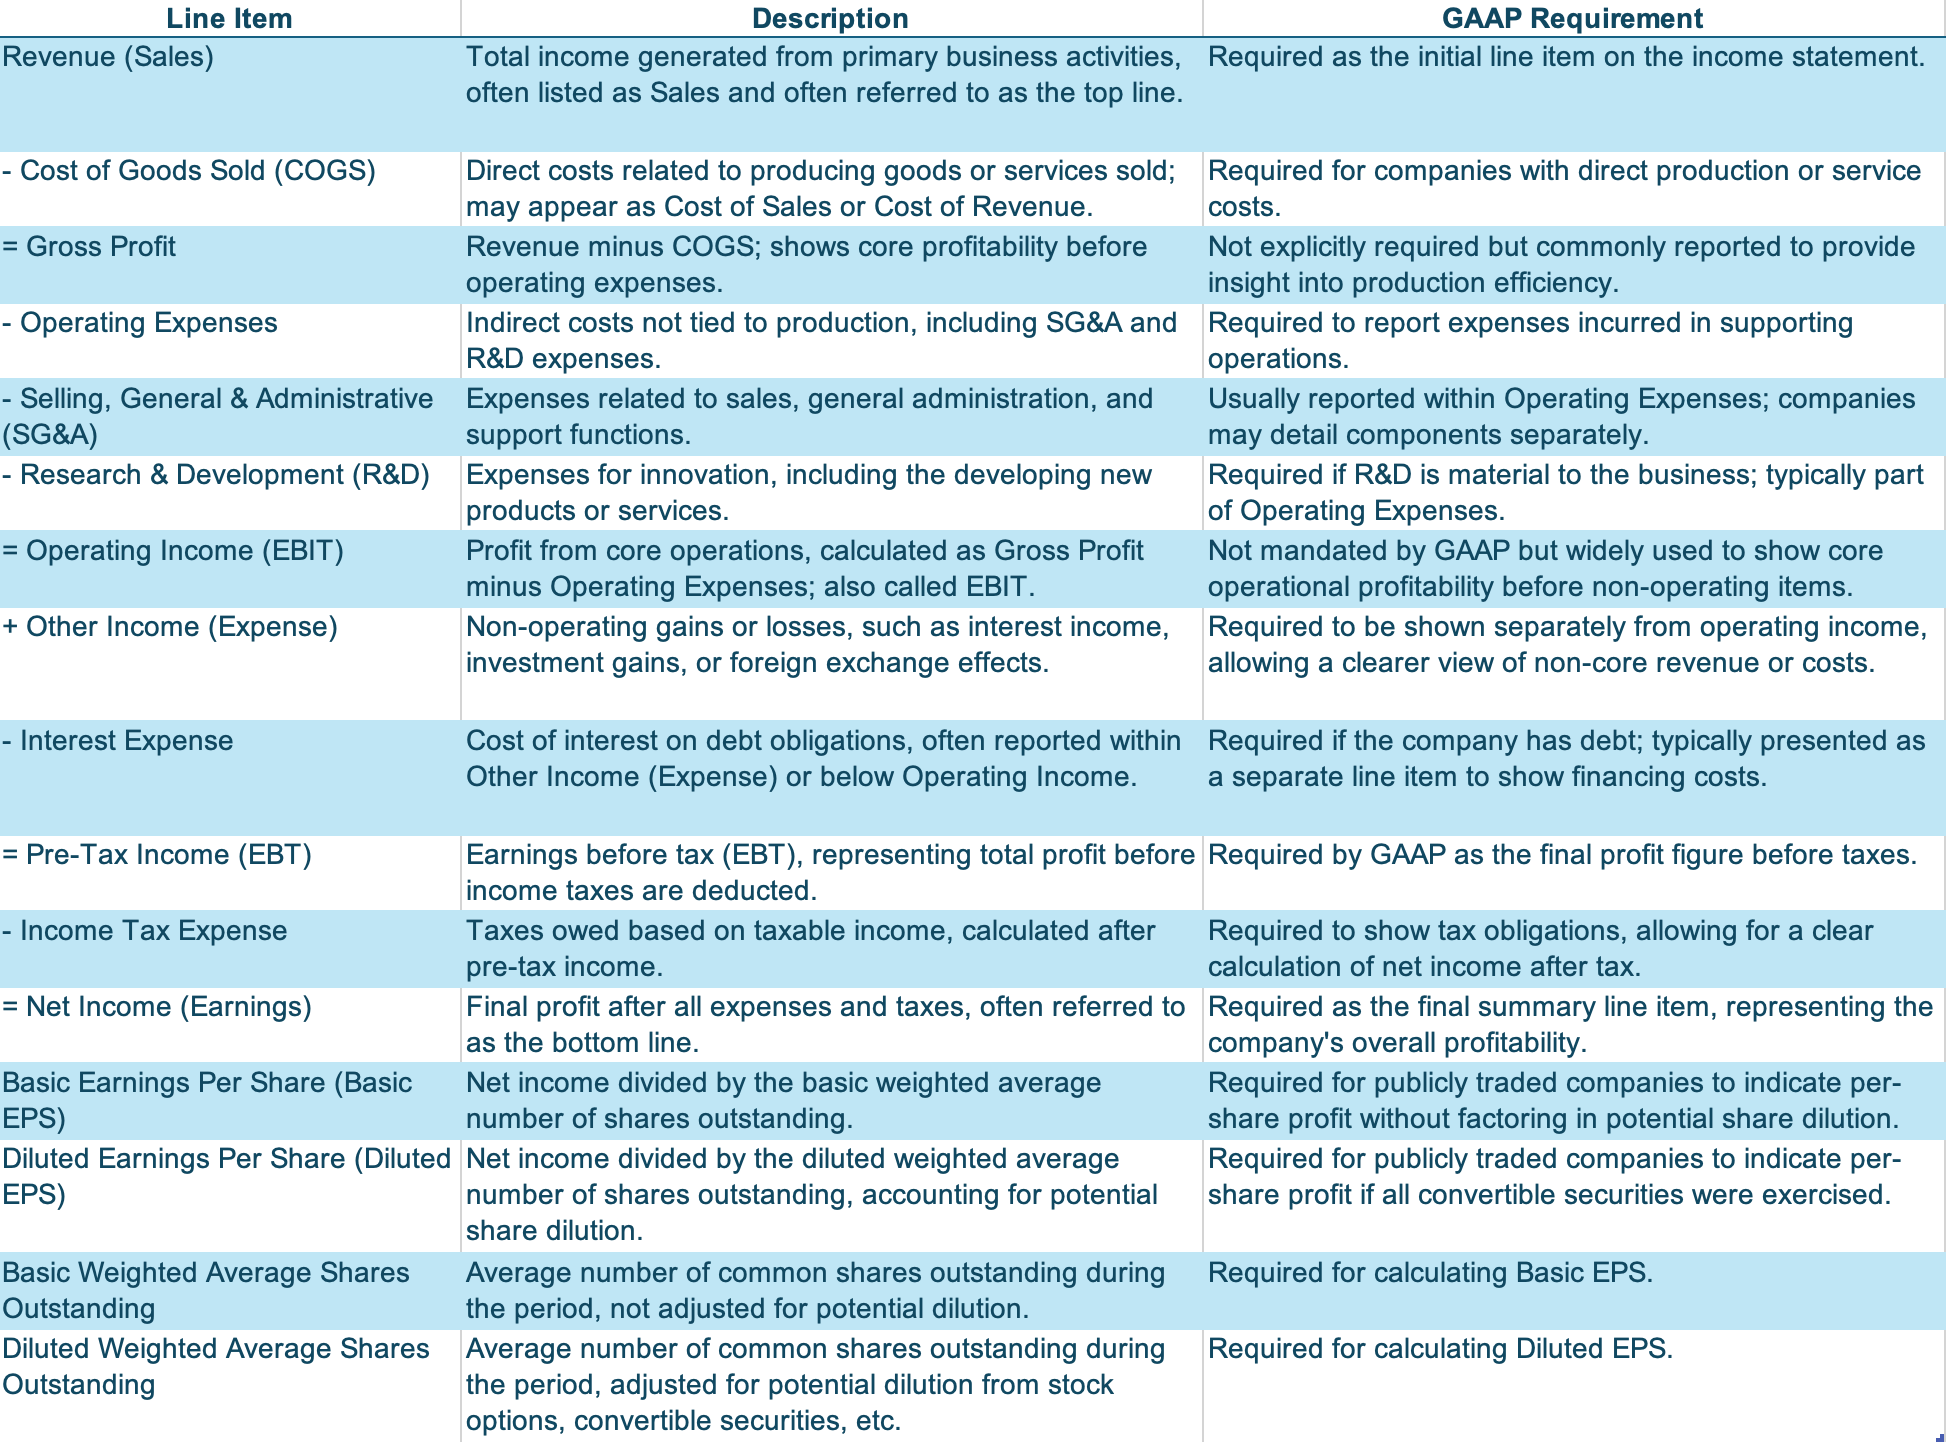
The Income Statement is one of the three main financial documents that public listed companies regularly release to keep the public and investors informed about the company’s operational performance. It is also called Profit & Loss Statement (or P&L Statement). The purpose of the income statement is to provide investors with a clear view of a company’s financial performance over a given period by showing how much revenue the company earned, the expenses incurred to generate that revenue, taxes paid, and the earnings generated for its shareholders.
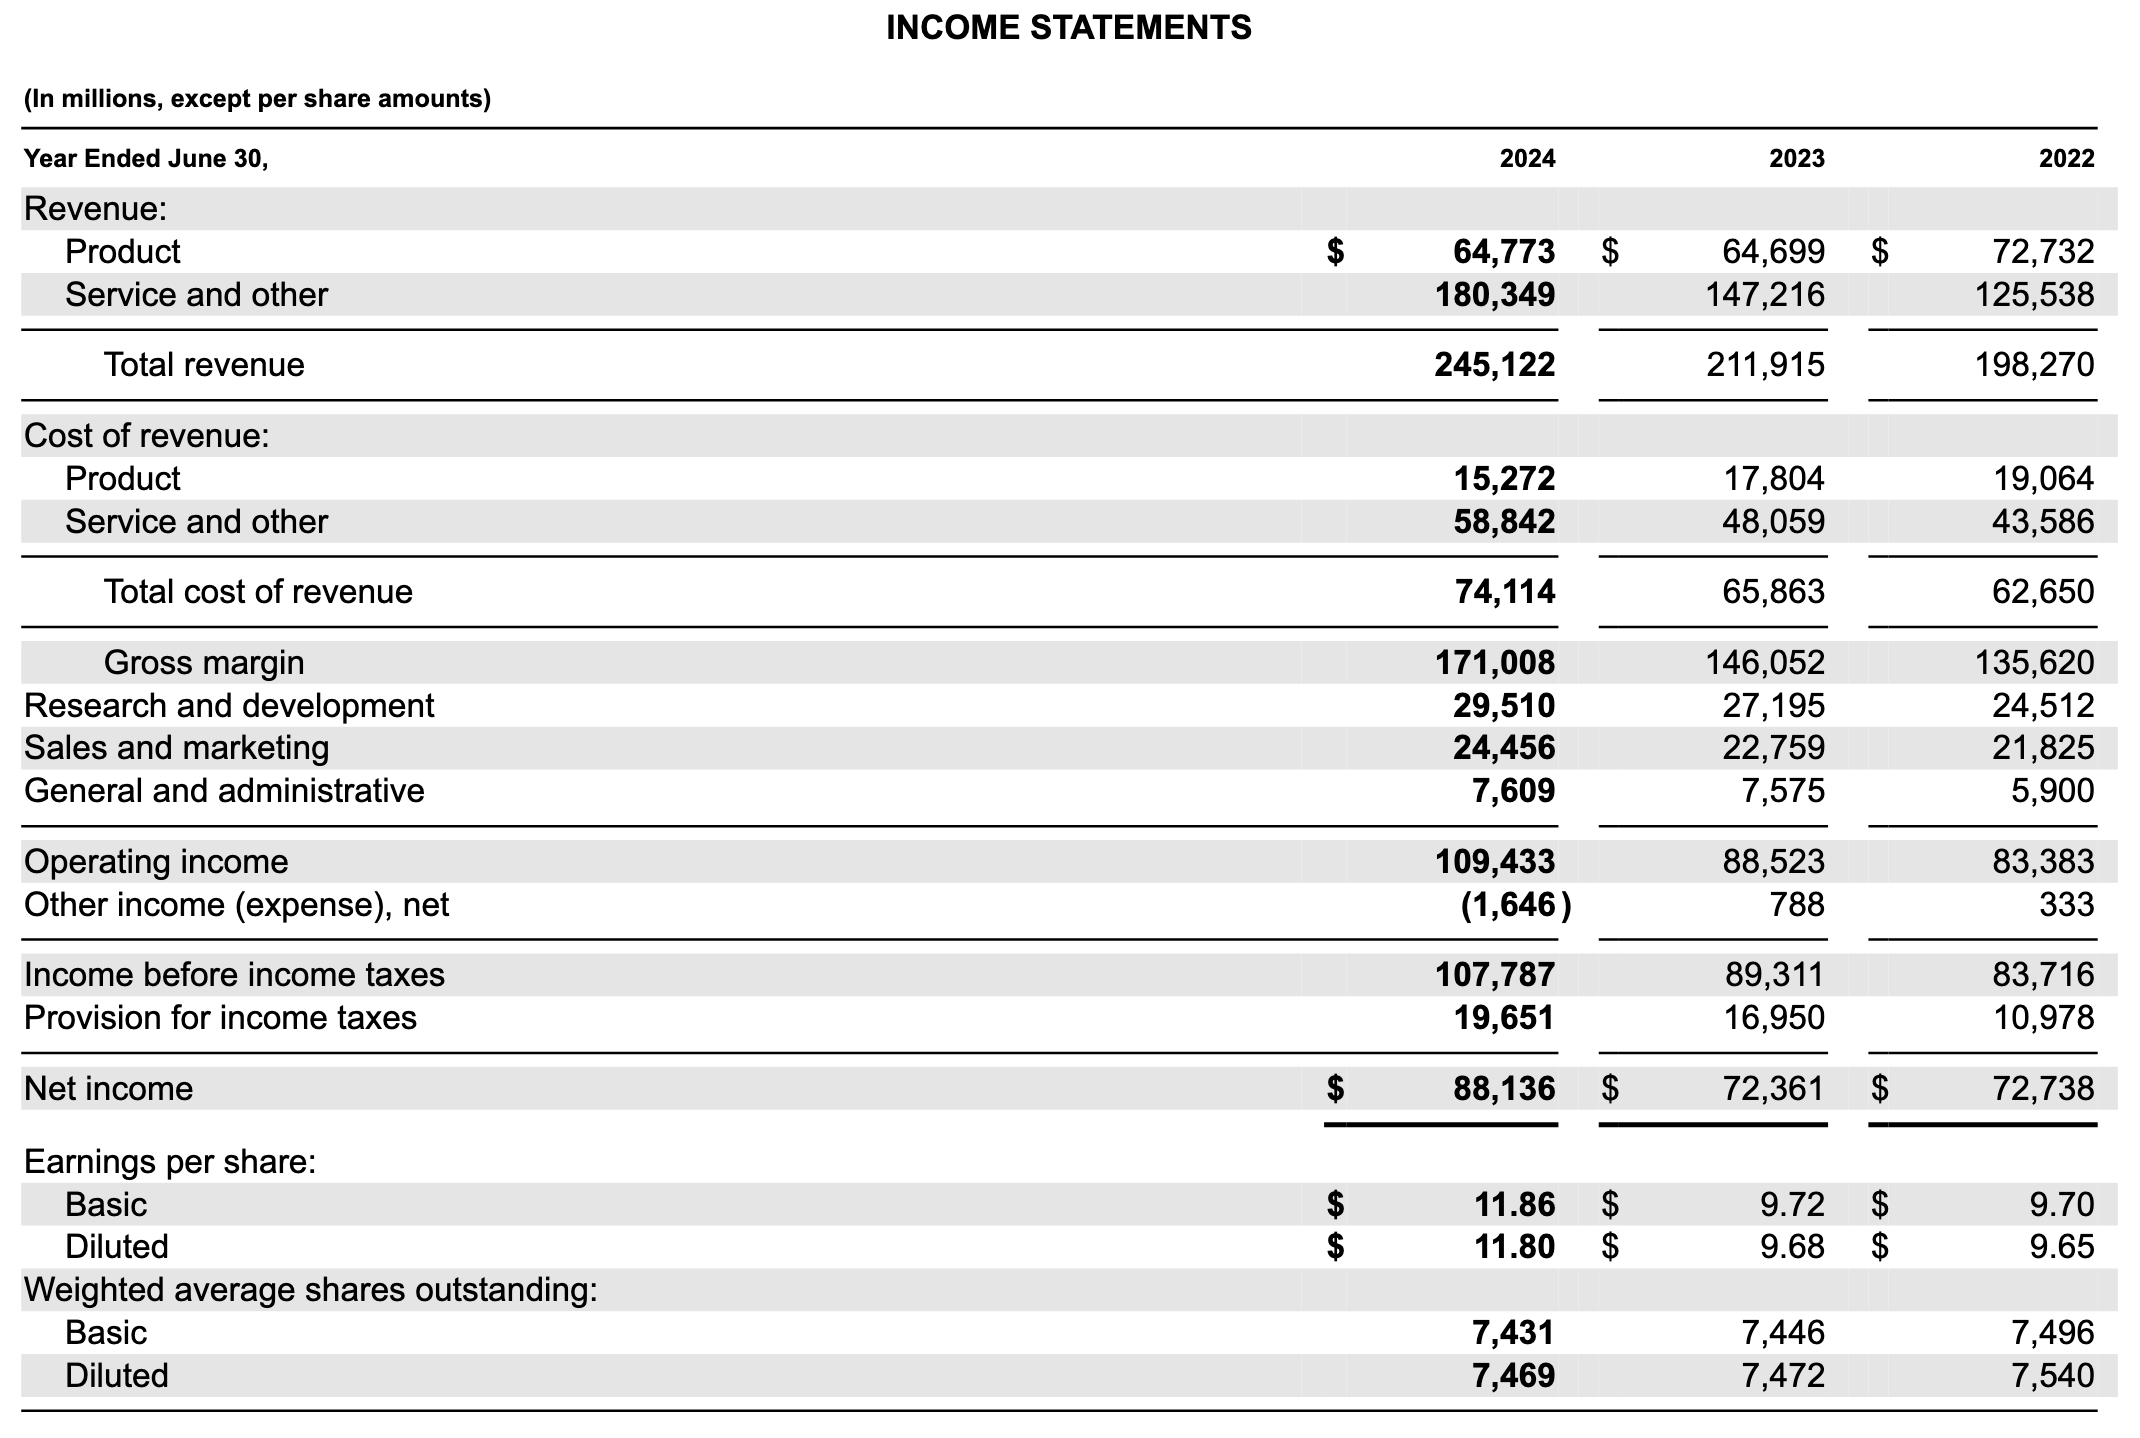
Let’s use Microsoft’s fiscal year 2024 income statement as an example.
The Anatomy of the Income Statement
The income statement is prepared using accrual accounting, which records revenue and expenses when they are earned or incurred, rather than when cash actually changes hands. This method provides an accurate view of a company’s financial activity within a given period (typically over 3, 6 or 12 months), aligning revenue with the expenses incurred to generate it.
The income statement is structured in a top-down format, where each line progressively refines the understanding of the company’s profitability. Reading from top to bottom, the statement begins with revenue, often referred to as the top line, and concludes with net income, the bottom line. Each subsequent line item captures a portion of the company’s expenses, ultimately showing how much profit remains after all material costs and non-cash costs are accounted for.
Revenue (Sales)
Revenue, often called the top line, represents the total income generated from goods sold and services rendered. It is the starting point of the income statement and reflects the company’s ability to generate sales. This figure shows how well a company is performing in terms of demand and sales. Revenue is typically adjusted for returns, discounts, or allowances, resulting in the final sales figure.
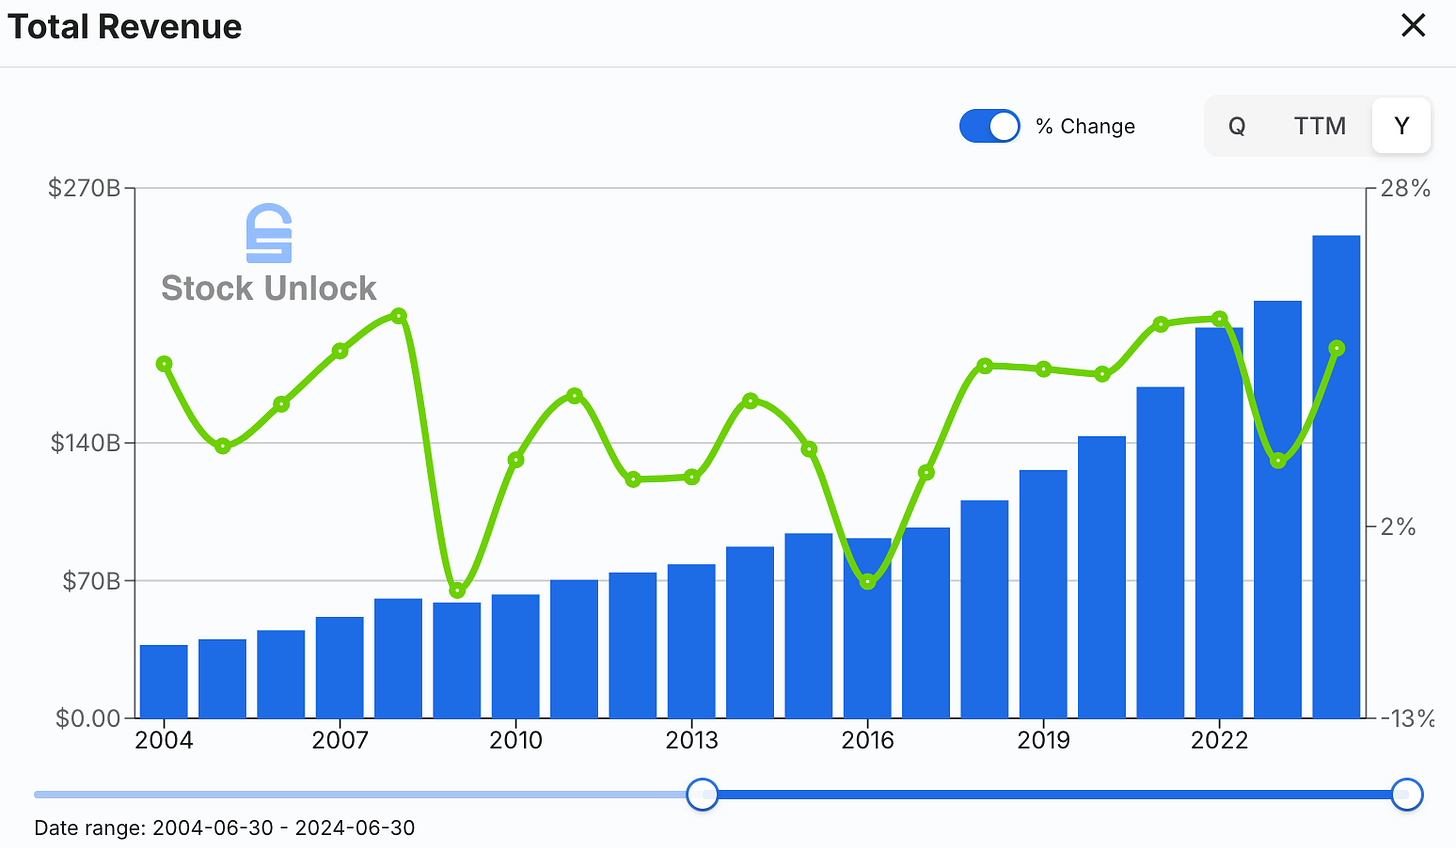
Consistent revenue growth over a long period indicates increasing demand for the company’s goods and services, price hikes, or a combination of both. In contrast, declining or volatile growth may suggest issues with the business’ market positioning or cyclical demand, as seen in companies operating in commodity industries.
For example, Microsoft generated $245.122 billion in sales in fiscal year 2024. Twenty years earlier, in fiscal year 2004, it generated $36.835 billion in sales. This nearly sixfold increase over 20 years demonstrates the company’s expansion of its product and service offerings. This, coupled with price increases, has driven steady growth in demand, translating into a Compounded Annual Growth Rate (CAGR) of 9.94%. From this revenue, all costs and expenses, including those related to production, operations, interest, and taxes, are deducted to arrive at net income, also referred to as earnings or profits, or simply the bottom line.
Revenue Health Check: Red Flags to Watch For
Declining revenue is a major red flag as it suggests the company may be struggling with demand, market relevance, or competitive positioning. When a company’s revenue shrinks over time, it can indicate that customers are moving to competitors, that the company’s offerings are losing appeal, or that broader market trends are shifting against the business. Declining revenue may also hint at ineffective sales strategies, product obsolescence, or a failure to innovate and meet changing consumer needs. If left unchecked, persistent revenue decline can erode profitability, strain cash flow, and ultimately impact the company’s financial health and investors’ confidence. Analyzing the causes of declining revenue is essential, as it provides insights into whether the issue is temporary or signals a more fundamental problem with the business.
Inconsistent or unpredictable revenue patterns, such as sharp spikes or drops over short periods, can indicate a company’s reliance on one-time sales, uncertain economic environment, or challenges with customer retention. Consistent revenue growth, on the other hand, suggests a stable customer base and effective demand generation. I also watch for unusually high revenue spikes without corresponding cost increases, as these may stem from one-time events or acquisitions. If the spike is due to an acquisition, the cost paid and quality of the acquired business should be assessed separately to evaluate the true impact on revenue growth.
A high proportion of deferred revenue, income collected in advance for goods or services not yet delivered, may signal revenue inflation, potentially masking shortfalls in actual sales or delivery capacity. Similarly, heavy reliance on a few key customers creates revenue vulnerability if even one reduces orders or switches providers.
Rapid growth in accounts receivable (recorded under Current Assets in the Balance Sheet) can indicate issues with payment collection, often due to loose credit policies or financially struggling customers. This inflates reported revenue but does not contribute to cash flow. Rising sales returns or allowances, meanwhile, may indicate customer dissatisfaction, product quality problems, or overly aggressive sales tactics, potentially leading to revenue reversals.
An over-reliance on discounts or incentives to drive revenue can point to weak demand, and though effective for short-term boosts, it often compresses margins and casts doubt on sustainability.
Unusual year-end revenue spikes may result from channel stuffing1 or bill and hold2 tactics, where companies respectively push distributors to stock up at the period’s end and clients to recognize revenue before delivery. Both tactics temporarily inflate revenue but may lead to weaker sales in following periods. Additionally, revenue growth that significantly outpaces industry trends and the company’s long term sales growth without a clear catalyst, such as new products or market expansions, can suggest unsustainable or aggressive accounting practices.
Lastly, frequent changes in revenue recognition policies, often noted in footnotes of the 10-Q and 10-K reports, can indicate that management is manipulating reporting timing to meet targets. Such adjustments raise questions about revenue reliability.
Watching these red flags provides deeper insights into the quality and sustainability of a company’s revenue. When they arise, delving into disclosures, footnotes and management discussions in the quarterly and annual reports often clarifies underlying issues.
Cost of Goods Sold (COGS)
Cost of Goods Sold (COGS) is also known as Cost of Sales or Cost of Revenue as Microsoft calls it in its income statement. It represents the cost associated with producing and delivering its products and services to customers. This line item includes all expenses directly tied to manufacturing, distributing, and preparing the company’s offerings for sale.
For Microsoft, COGS covers a wide range of costs, such as the expenses associated with developing and maintaining its software and hardware products, the infrastructure needed to support its cloud services, and the reseller network involved in delivering its physical products to customers. It may also encompass costs related to data center operations, and customer support for its software products. By accounting for these direct expenses, COGS provides insight into the resources Microsoft invests in creating its products and services.
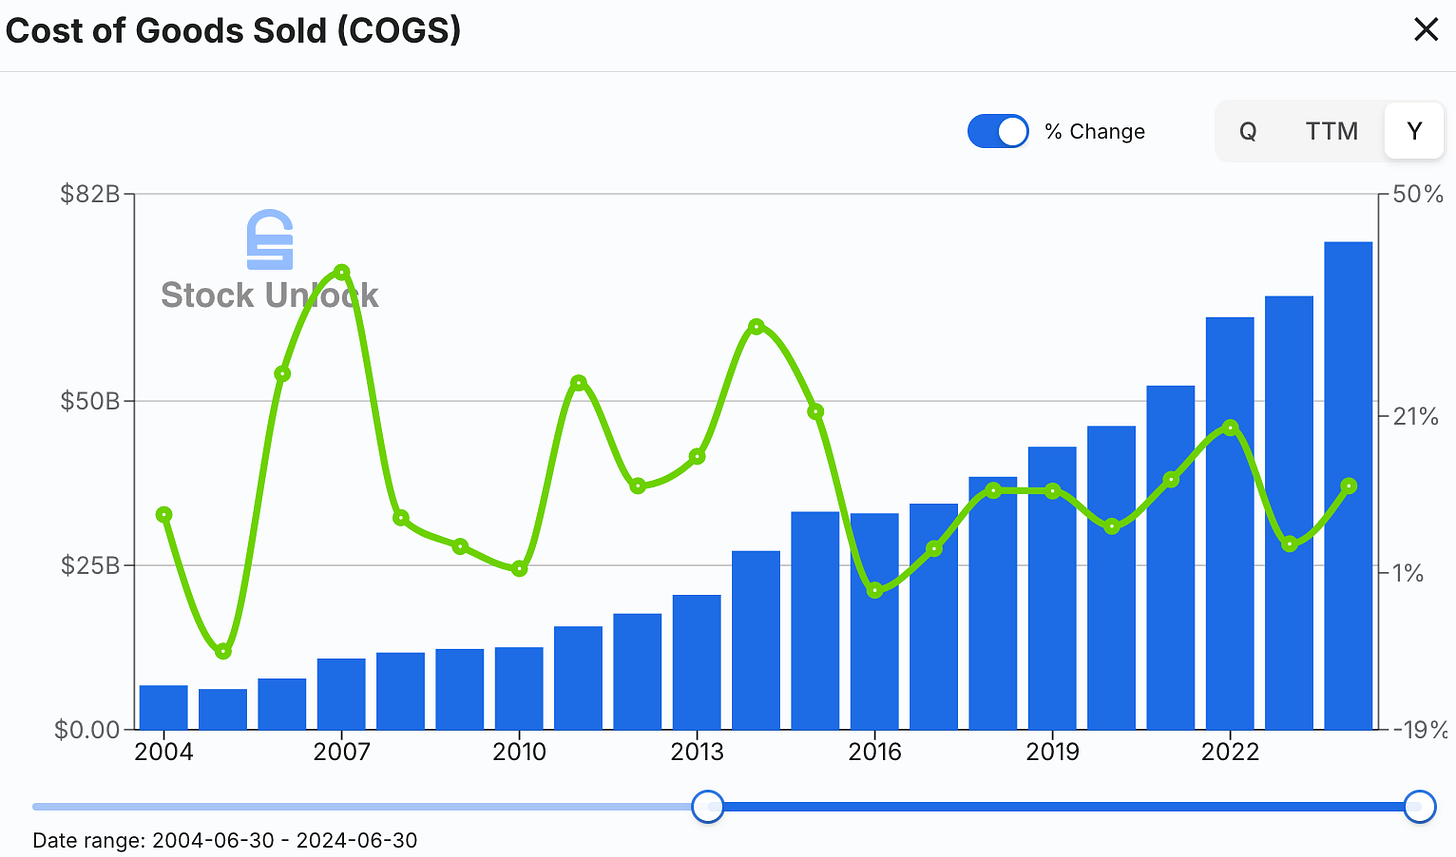
Analyzing COGS trends helps me understand whether the company is effectively managing its production and operational costs as it scales its business across diverse markets and product lines.
Gross Profit
COGS is essential for calculating Gross Profit (Microsoft calls it Gross margin), which is obtained by subtracting COGS from revenue. Essentially, it’s the profit generated from core operations before accounting for other fixed costs. This figure offers a glimpse into the company’s production efficiency, as it reflects how well the company manages direct costs involved in making products and providing services.
Increasing gross profits typically signal that a company is improving its production efficiency or successfully increasing sales while keeping COGS steady. It is important to remember that gross profit is a partial measure of profitability that doesn’t account for fixed costs like rent, insurance, and salaries. Companies use gross profit to cover these additional operating expenses before reaching net income.
While gross profit can be helpful in evaluating the profit potential of companies that are not yet fully profitable or are heavily investing in growth, it is only one part of the financial picture. Gross profit needs to be positive for me to look further into a company; a negative gross profit can indicate significant financial challenges, as the company is losing money on production alone.
In 2024, Microsoft incurred $74,114 billion of COGS, leaving $171,008 billion in gross profit.
Gross Margin Ratio
Gross margin is a financial metric that represents the percentage of revenue remaining after covering the direct costs of producing goods and providing services (COGS). It’s essentially the ratio of gross profit to revenue, expressed as a percentage. Ratios are useful for standardizing comparisons across companies, time periods, or industries. The formula for gross margin is:
(Gross Profit / Revenue) * 100The gross margin should always be positive, as a negative or zero gross margin indicates that the company’s production costs exceed its sales, making it unsustainable. When evaluating an investment, I check whether a company’s gross margin is improving (expanding margin) or declining (contracting margin) over time, as this can reveal trends in its profitability. A company with expanding gross margin is preferred, as it suggests that it is keeping COGS steady while growing its revenue.
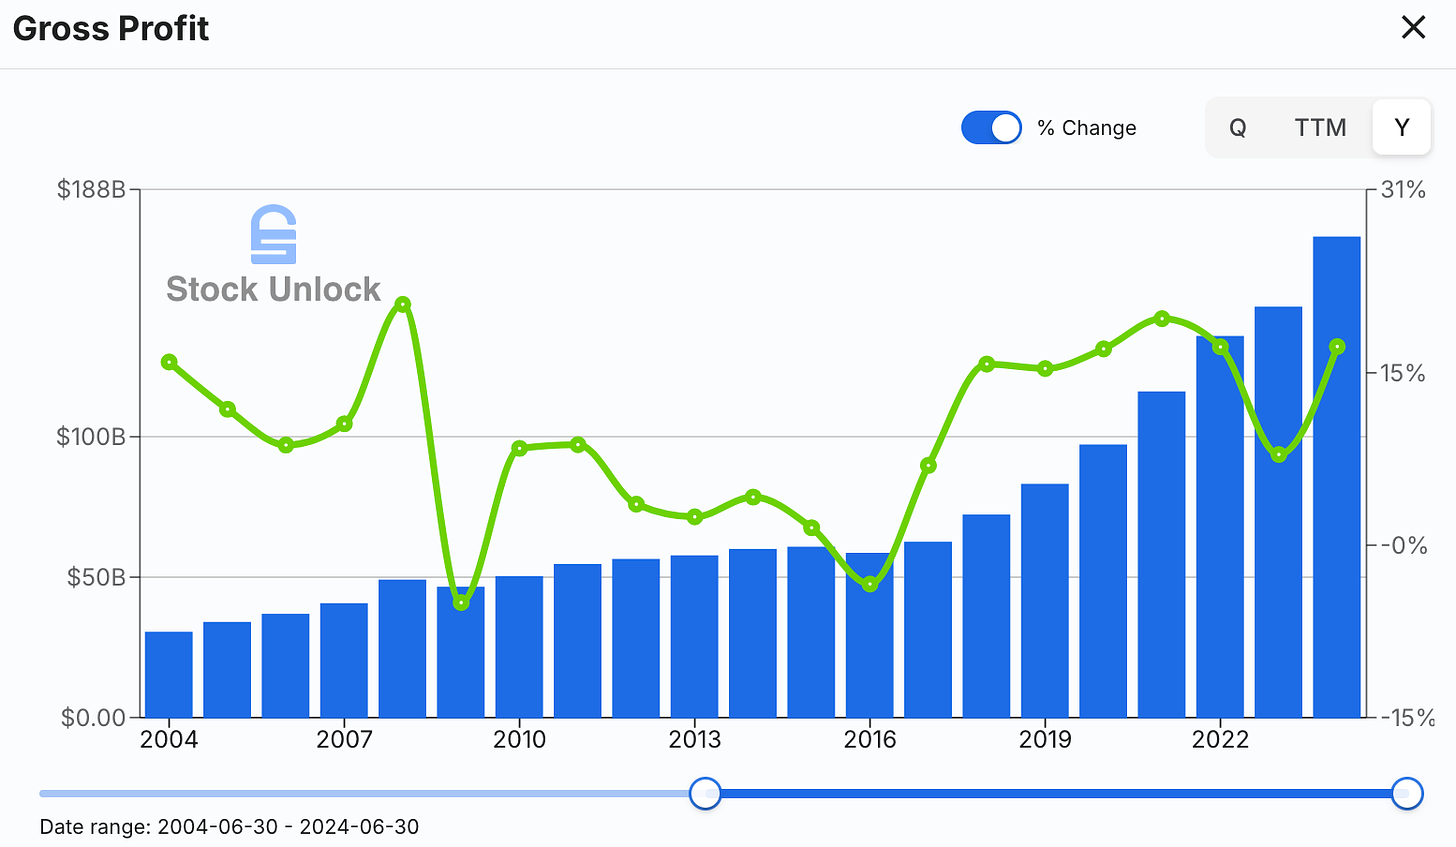
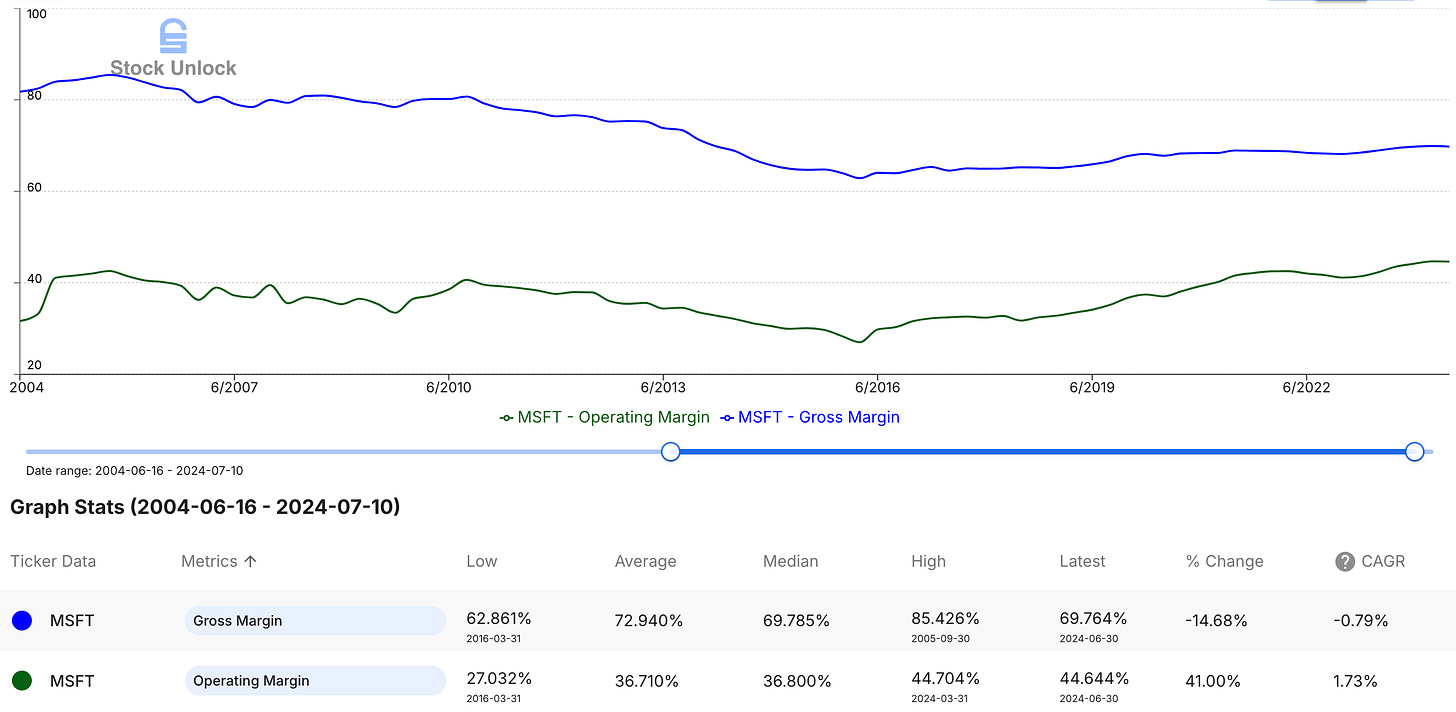
In the case of Microsoft, gross margin has contracted over the past two decades from 82.09% in 2004 to 69.76% in 2024 (CAGR -0.79%). This downward trend suggests that while Microsoft has successfully grown its revenue and gross profit, its COGS has increased at a faster pace, impacting the proportion of revenue retained as gross profit.
Expanding Revenue and Rising COGS Over Two Decades
When examined in isolation, the trend of COGS over time provides limited insight in financial analysis. It should always be assessed in relation to revenue growth over the same period to provide meaningful context.
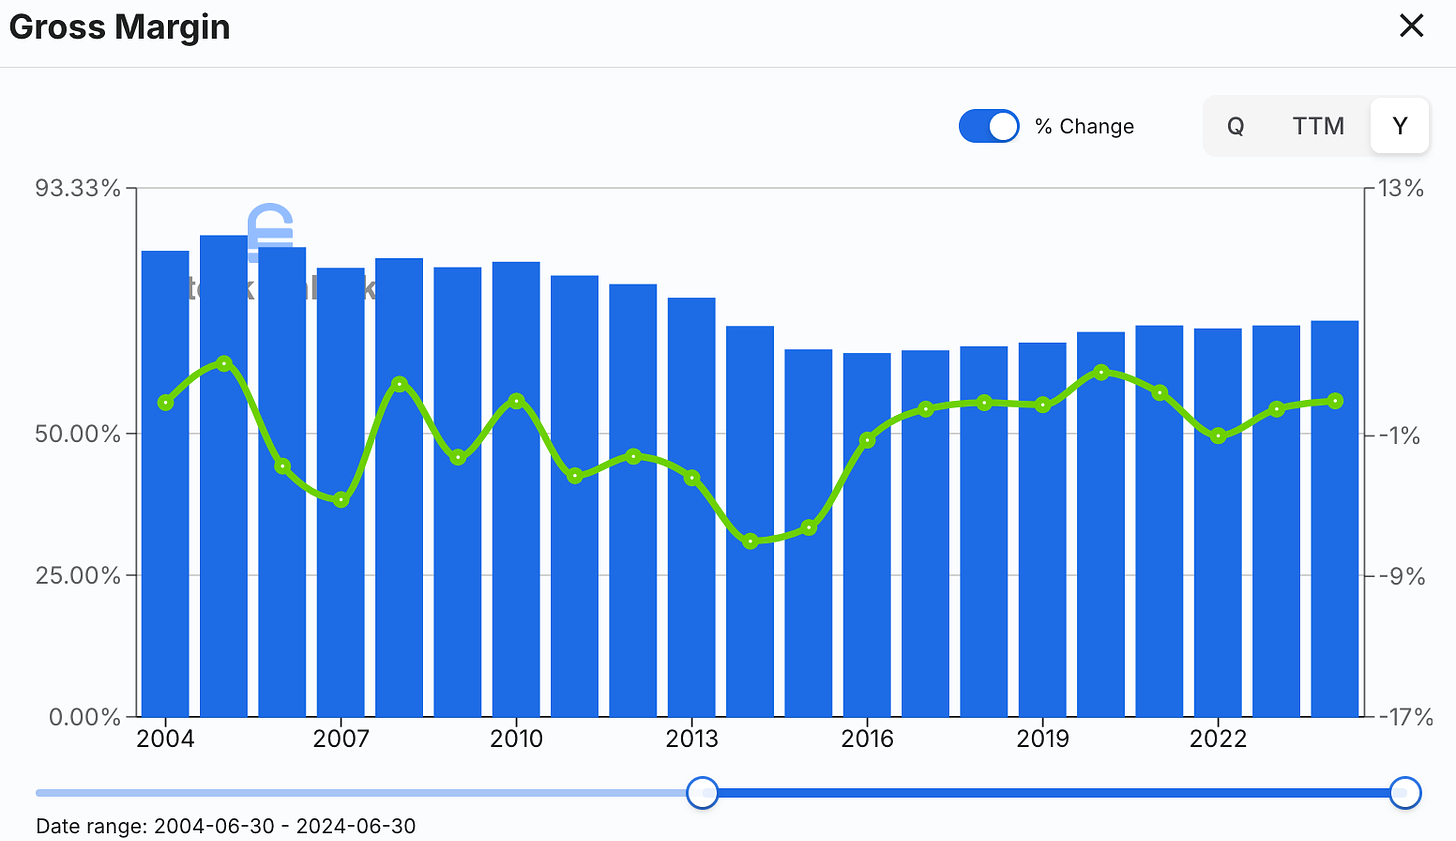
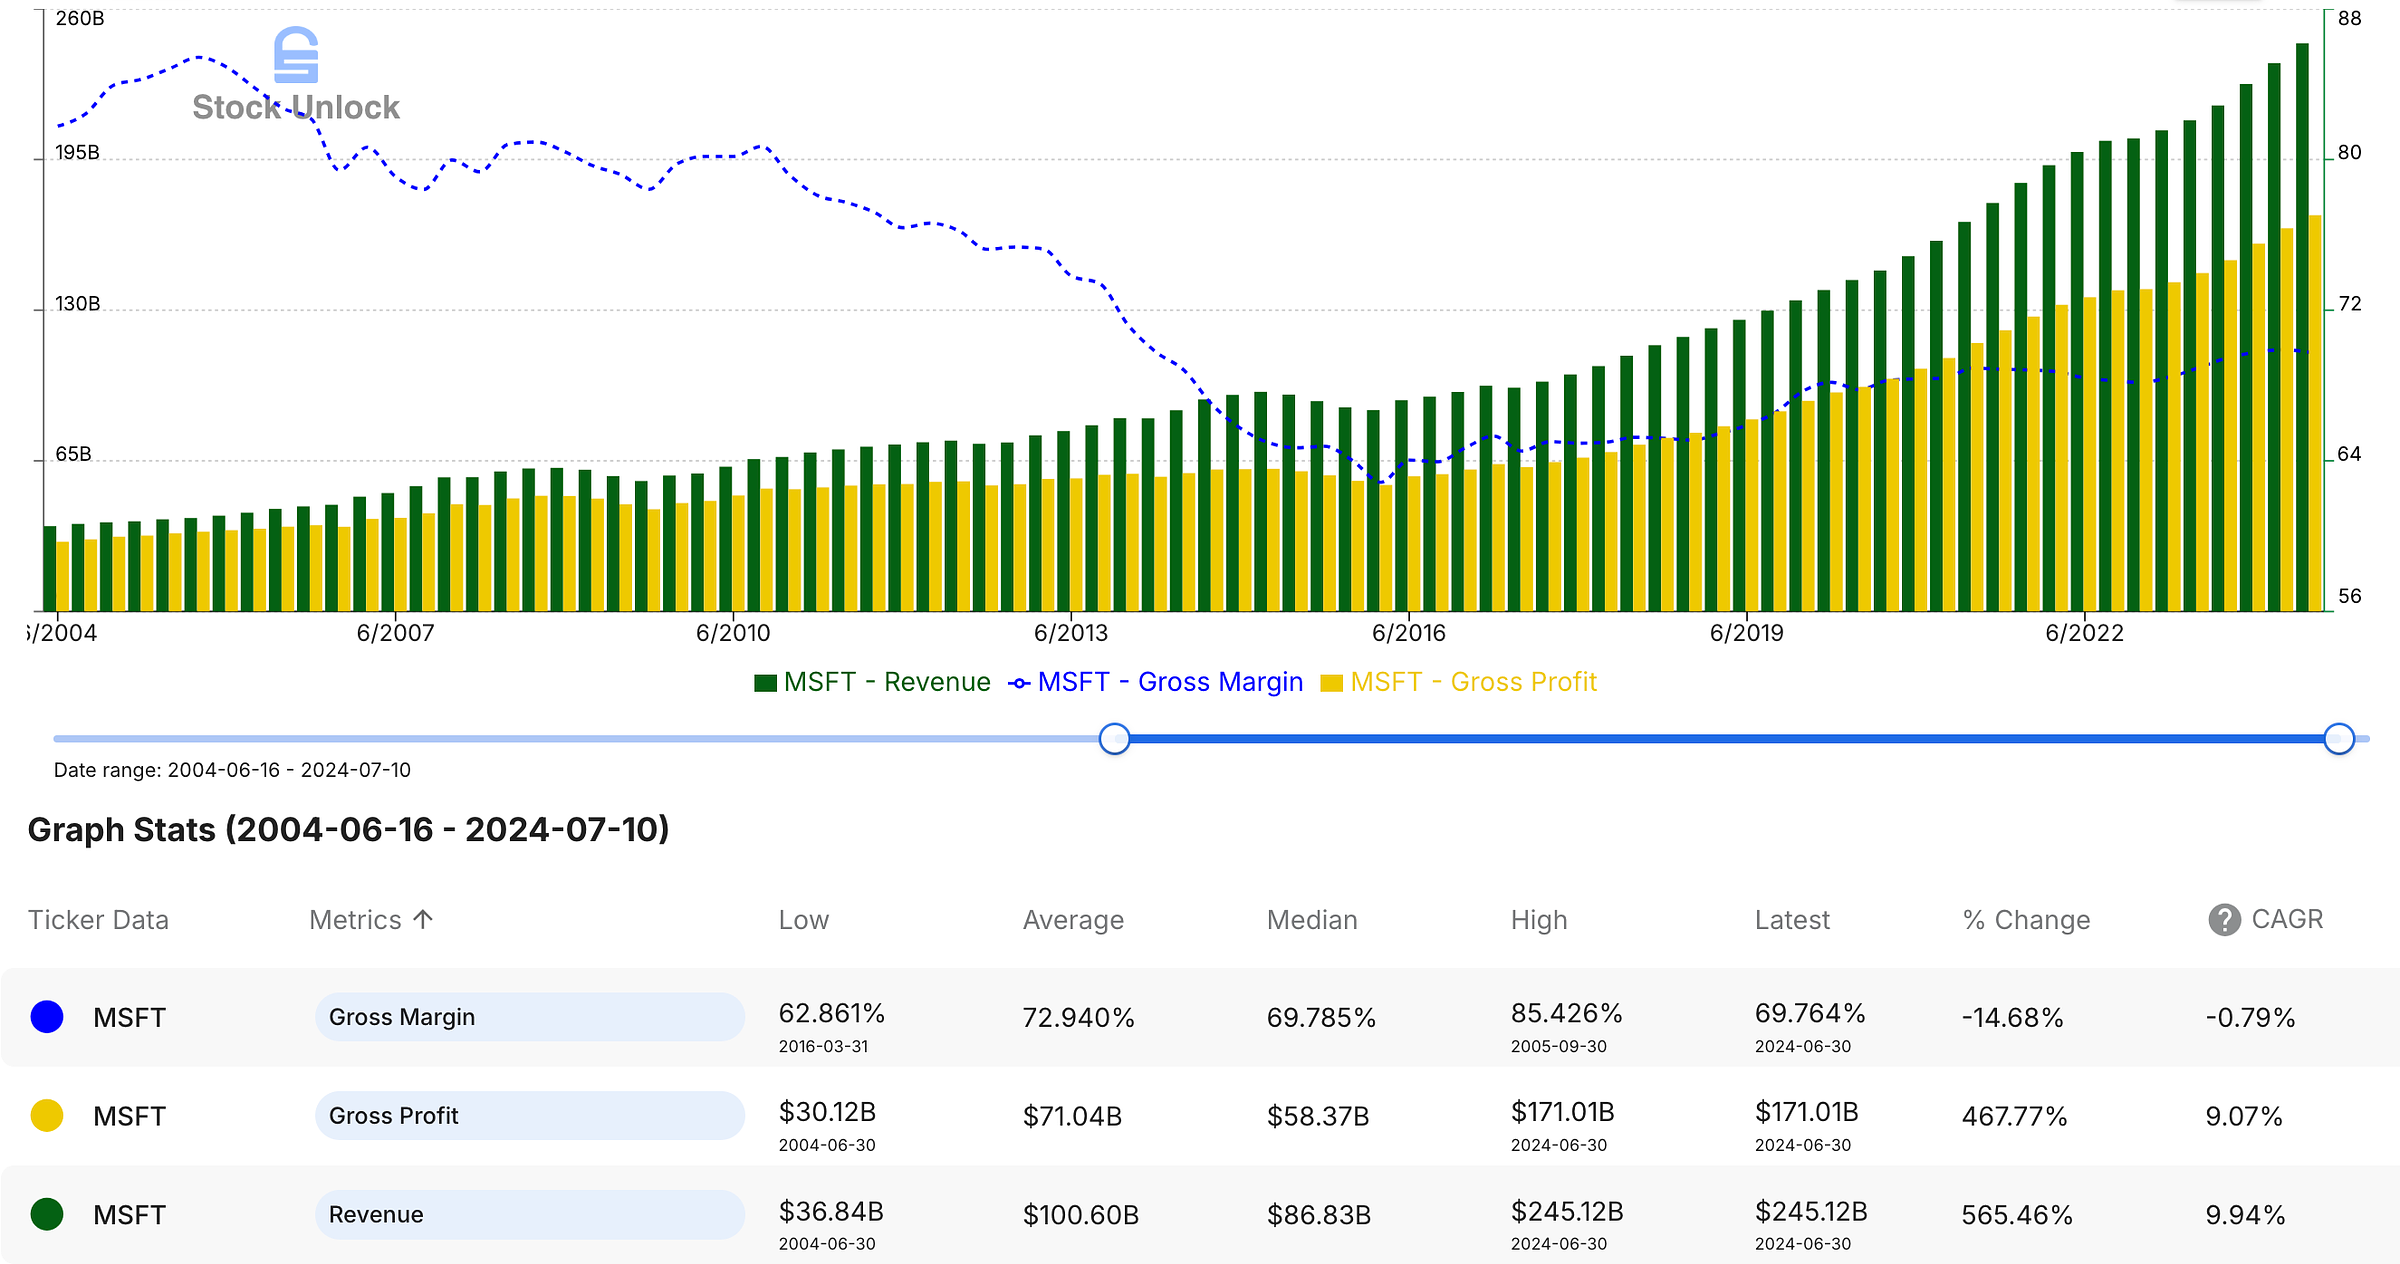
Over the 20-year period from 2004 to 2024, Microsoft’s revenue surged from $36.835 billion to $245.122 billion, representing a CAGR of 9.94%. Similarly, gross profit grew significantly, from $30.239 billion in 2004 to $171.008 billion in 2024, with a slightly lower CAGR of 9.07%. This growth reflects Microsoft’s expansion and the increasing demand for its products and services, driven by a combination of its shift to a subscription-based business model, strategic innovations, and acquisitions.
The gross margin percentage, however, shows a more varied trajectory, peaking at 85.43% in September 2005 and declining over the years to 69.76% by 2024, representing a CAGR of -0.79%. This decline suggests that while Microsoft’s revenue and gross profit increased, its production costs (COGS) have risen at a faster pace, ultimately compressing the gross margin. This shift reflects the company’s strategic focus on high-cost, high-growth areas, particularly since Satya Nadella took the helm in early 2014 and prioritized innovation in cloud services and AI capabilities. Investments in cloud infrastructure accelerated between 2012 and 2015, with additional recent investments in AI, as Microsoft scaled its cloud service offerings to meet growing demand in an increasingly competitive tech landscape.
While the gross margin remains strong, the gradual compression highlights the cost pressures Microsoft faces in maintaining competitive pricing, managing large-scale data centers, and delivering high-quality products and services. Overall, the sustained increase in revenue and gross profit points to robust growth, while the trend in gross margin provides valuable insight into the evolving cost dynamics that impact Microsoft’s long-term profitability.
COGS and Gross Profit Health Check: Red Flags to Watch For
Rapidly increasing COGS without a corresponding rise in revenue may signal rising input costs, inefficiencies in production, or supply chain challenges, all of which can erode gross margins and reduce profitability. If COGS fluctuates significantly, it may indicate that the company is struggling to control variable costs, suggesting vulnerability to suppliers’ price hikes or inconsistent production practices.
Negative gross profit indicates the company is losing money even before considering other operational expenses. This is a major red flag, signaling unprofitability. Conversely, a company can have positive gross profit yet still operate at a loss if its fixed costs or investments are substantial. I pay close attention to gross margins for companies that are not yet profitable or are heavily investing in growth, as it provides insight into the underlying profit potential of the business.
A declining gross profit margin over time is also a concerning trend, as it suggests the company is either losing pricing power, facing higher production costs that it cannot pass on to customers, or investing heavily in upfront costs that are expected to bear fruit over time. Additionally, aggressive reductions in COGS to boost gross profit might indicate that quality is being sacrificed, which can hurt customer satisfaction and long-term revenue.
I am cautious when COGS and gross profit patterns seem erratic or unsustainable, as these are often early warning signs of operational or market challenges.
Operating Expenses
Operating expenses, also known as overhead expenses, are the indirect, recurring costs a business incurs to support its daily functions and maintain regular operations, and they are not directly tied to the production of goods and services. These expenses encompass a range of essential outlays, including rent, utilities, employees’ salaries, insurance, office supplies, and sales and marketing efforts. They also cover investments in growth and innovation, such as research and development (R&D) costs, which are crucial for advancing new products and services and staying competitive in the market.
Operating expenses are categorized into categories, each capturing specific aspects of a company’s spending:
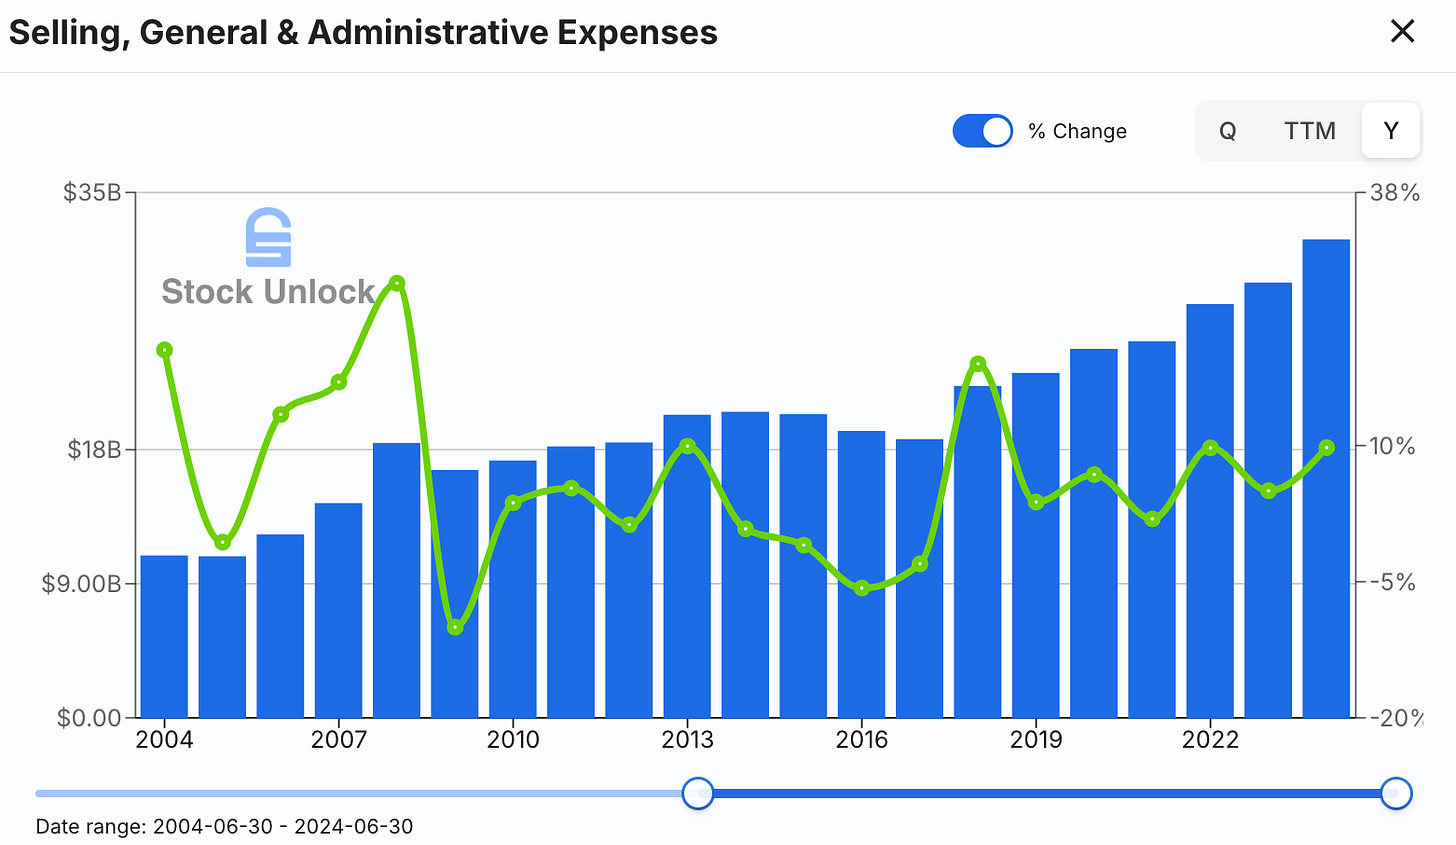
Selling, General, and Administrative (SG&A): This category includes a variety of costs associated with supporting the business’s operations and growth, such as marketing, advertising and promotional expenses, salaries of administrative staff, stock-based compensation (SBC), and office expenses. It also records expenses for legal and consulting services and any other costs that support day-to-day business functions. For instance, Microsoft would include expenses for marketing its software and salaries of sales teams in SG&A. Microsoft breaks down this line item into Sales and marketing ($24,456 billion in 2024) and General and administrative ($7,609 billion in 2024).
Research and Development (R&D): For companies like Microsoft, R&D is a significant expense, covering costs for developing new technologies, software, and other products that drive innovation and competitiveness. GAAP requires companies to expense R&D costs as incurred, emphasizing their recurring nature and impact on net income. Microsoft incurred R&D costs of $29,510 billion in 2024.
Non-Cash Charges in Operating Expenses
GAAP requires companies to record certain non-cash expenses under operating expenses, reflecting the gradual allocation of costs over time without actual cash outflow:
Depreciation: This entry reflects the gradual reduction in value of tangible assets like machinery, buildings, and equipment. By depreciating these assets, companies allocate their cost across their useful lives, which reduces reported income without immediate cash impact. For example, Microsoft depreciates its data center equipment and office buildings over several years. In some cases, particularly in manufacturing or production-heavy industries, depreciation related to machinery, factories, and equipment directly involved in production is included in COGS.
Amortization: Similar to depreciation, amortization applies to intangible assets such as patents, trademarks, and licenses. For instance, Microsoft amortize the cost of a software patent or acquired technology over its useful life, reflecting its diminishing value on the income statement.
Stock-Based Compensation (SBC): When employees receive compensation in the form of company stock or options, the value of these shares is recorded as an expense, even though it does not involve immediate cash outflow. This is common in technology companies, where SBC is used to attract and retain top talent. For Microsoft, the cost of issuing shares to employees is included under operating expenses, affecting net income but not cash flow.
These line items under operating expenses are crucial in calculating net income, as they reduce reported profit on the income statement without impacting cash flow directly. To provide a clearer view of cash generation, these non-cash expenses are added back to net income in the Cash Flow Statement, allowing investors to separate accounting costs from actual cash inflows and outflows.
Operating Income (or Loss)
Operating income, or Income From Operations, represents the profit generated from a company’s core business activities before accounting for interest and tax expenses. It is calculated by subtracting operating expenses from gross profit. Often referred to as Earnings Before Interest and Taxes (EBIT), this metric provides a clear view of a company’s operational profitability, isolating the impact of its main revenue-generating activities from external factors such as financing costs and tax obligations.
Operating income is a valuable measure because it focuses solely on the efficiency and effectiveness of the company’s core operations, making it useful for comparing profitability across companies with different capital structures or tax rates. For example, a company with high operating income but substantial debt might still show strong operational performance even though its net income is affected by interest expenses. Similarly, a company in a low-tax jurisdiction could have a net income advantage, but operating income provides a standardized view of its true operational earnings.
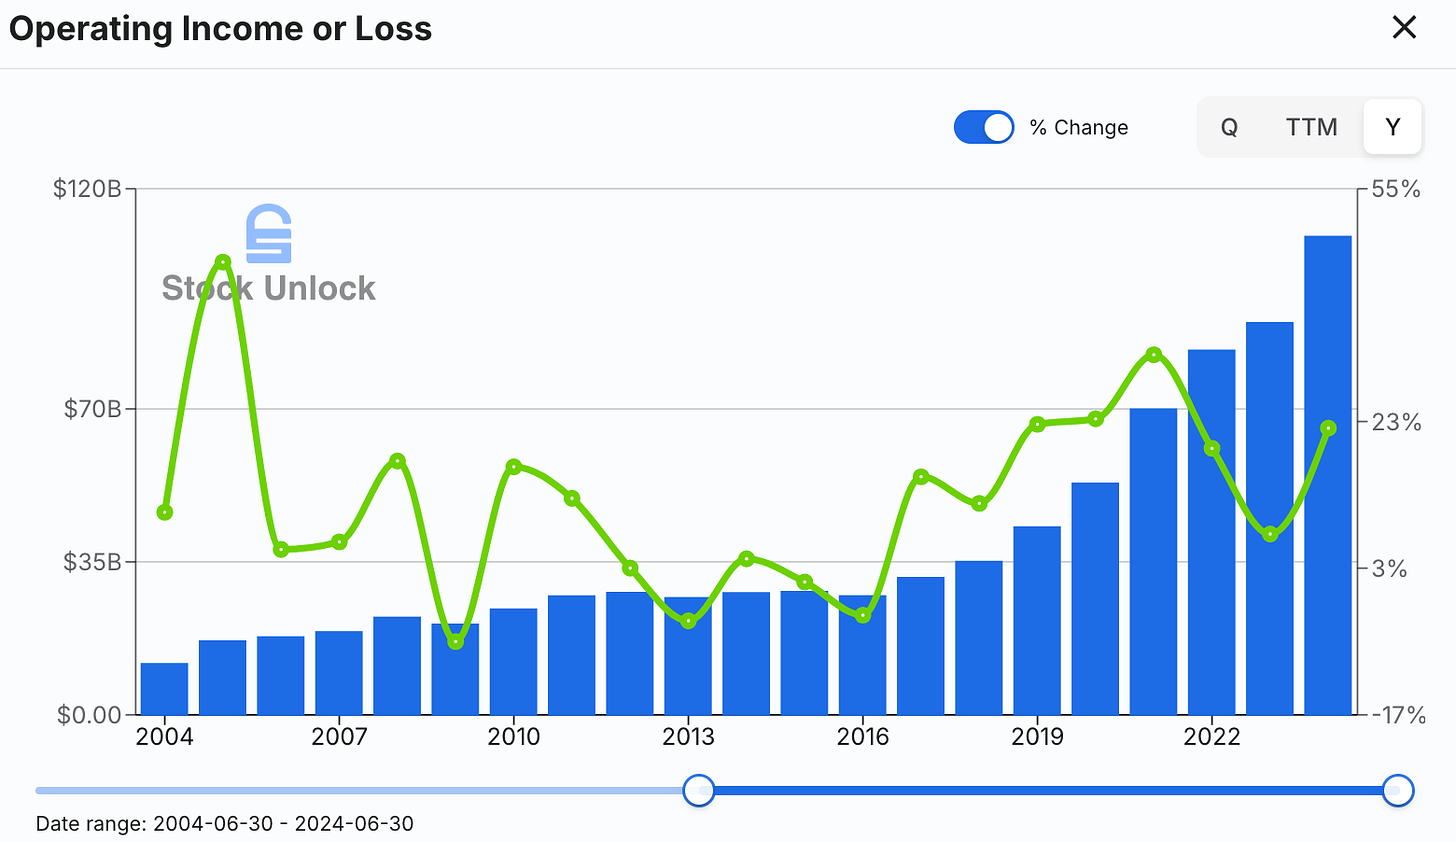
This metric is particularly helpful for assessing management’s ability to control costs and drive revenue, as it excludes any non-operational gains or losses, such as those from investments, or asset sales. I analyze operating income trends over time to gauge whether the company is improving its operational efficiency and cost management. A consistent increase in operating income typically signals strong demand for products and services, effective cost control and potentially the company being able to erode market share from competitors, while declines may suggest rising operating expenses or pricing pressures that impact profitability.
In 2024, Microsoft incurred $61,575 billion of operating expenses, leaving the business with $109,433 billion in operating income.
Operating Margin Ratio
Operating margin is a financial metric that measures how effectively a company’s core operations convert revenue into operating income, expressed as a percentage. It is calculated by dividing operating income by revenue and then multiplying by 100:
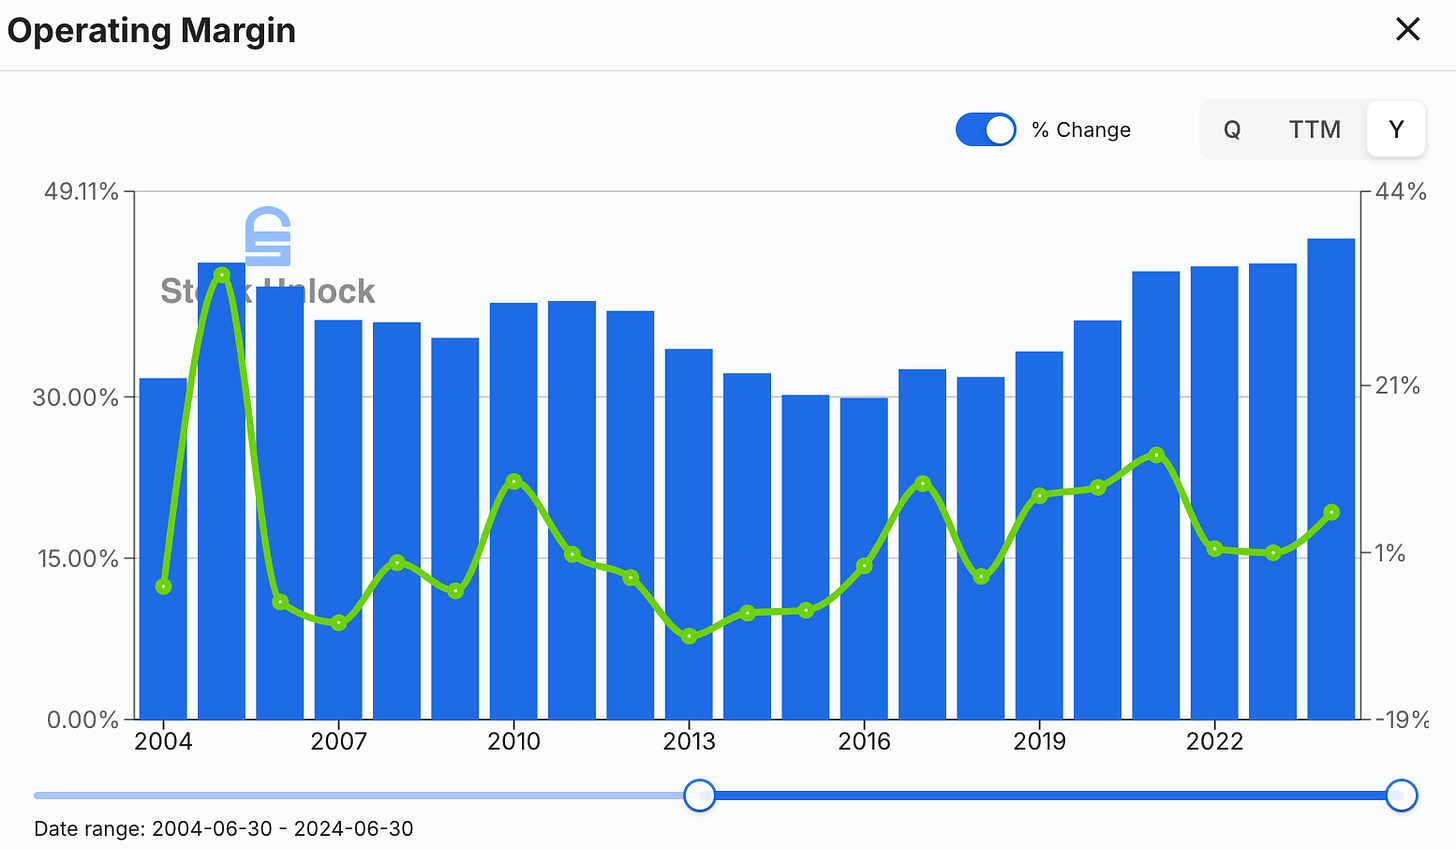
(Operating Income / Revenue) * 100This ratio reveals what portion of each dollar of revenue is retained as profit from operations after covering all operating costs. I monitor a company’s operating margin, as it provides insights into operational efficiency. By tracking operating margin trends over time, it is possible to assess whether the company is improving in efficiency or facing cost pressures. An increasing operating margin means the company is making more profit from its operations for every dollar of revenue, a positive sign of growing efficiency and financial health. Conversely, a declining margin may signal rising costs or pricing challenges, which can affect overall profitability.
It’s important to note that operating income, and thus the operating margin, is not the same as net income or net margin. A company may have a positive operating margin but still report a net loss due to high interest, tax expenses, or other non-operating costs. This metric is useful for evaluating companies that are investing heavily in growth with debt, hence with a passive interest expense, and are not yet profitable: A positive and expanding operating margin can indicate strong profit potential once debt’s principal is paid off. For profitable companies with high and growing operating margins, investors may be willing to pay premium valuations, as these companies demonstrate superior efficiency and profit power. A negative operating margin, however, indicates that the core operations are not profitable, signaling that the business as a whole is likely losing money.
In the case of Microsoft, operating margins have expanded over the past two decades, rising from 31.66% in 2004 to 44.64% in 2024 (CAGR of 1.73%), marking a record high since 2001.
Operational Leverage: Driving Margin Expansion and Income Growth
When assessed in isolation, the trend of operating income over time is of limited use in financial analysis. It should always be assessed in relation to the gross profit’s trajectory over the same time.
Operational leverage is a measure of how a company’s fixed and variable costs impact its profitability. High operational leverage means that a company has a higher proportion of fixed costs relative to variable costs, so an increase in sales leads to a more significant increase in operating income. This is because fixed costs remain constant as revenue grows, allowing more of the additional revenue to translate into profit. Operational leverage can amplify both profits in times of high sales and losses during low sales periods.
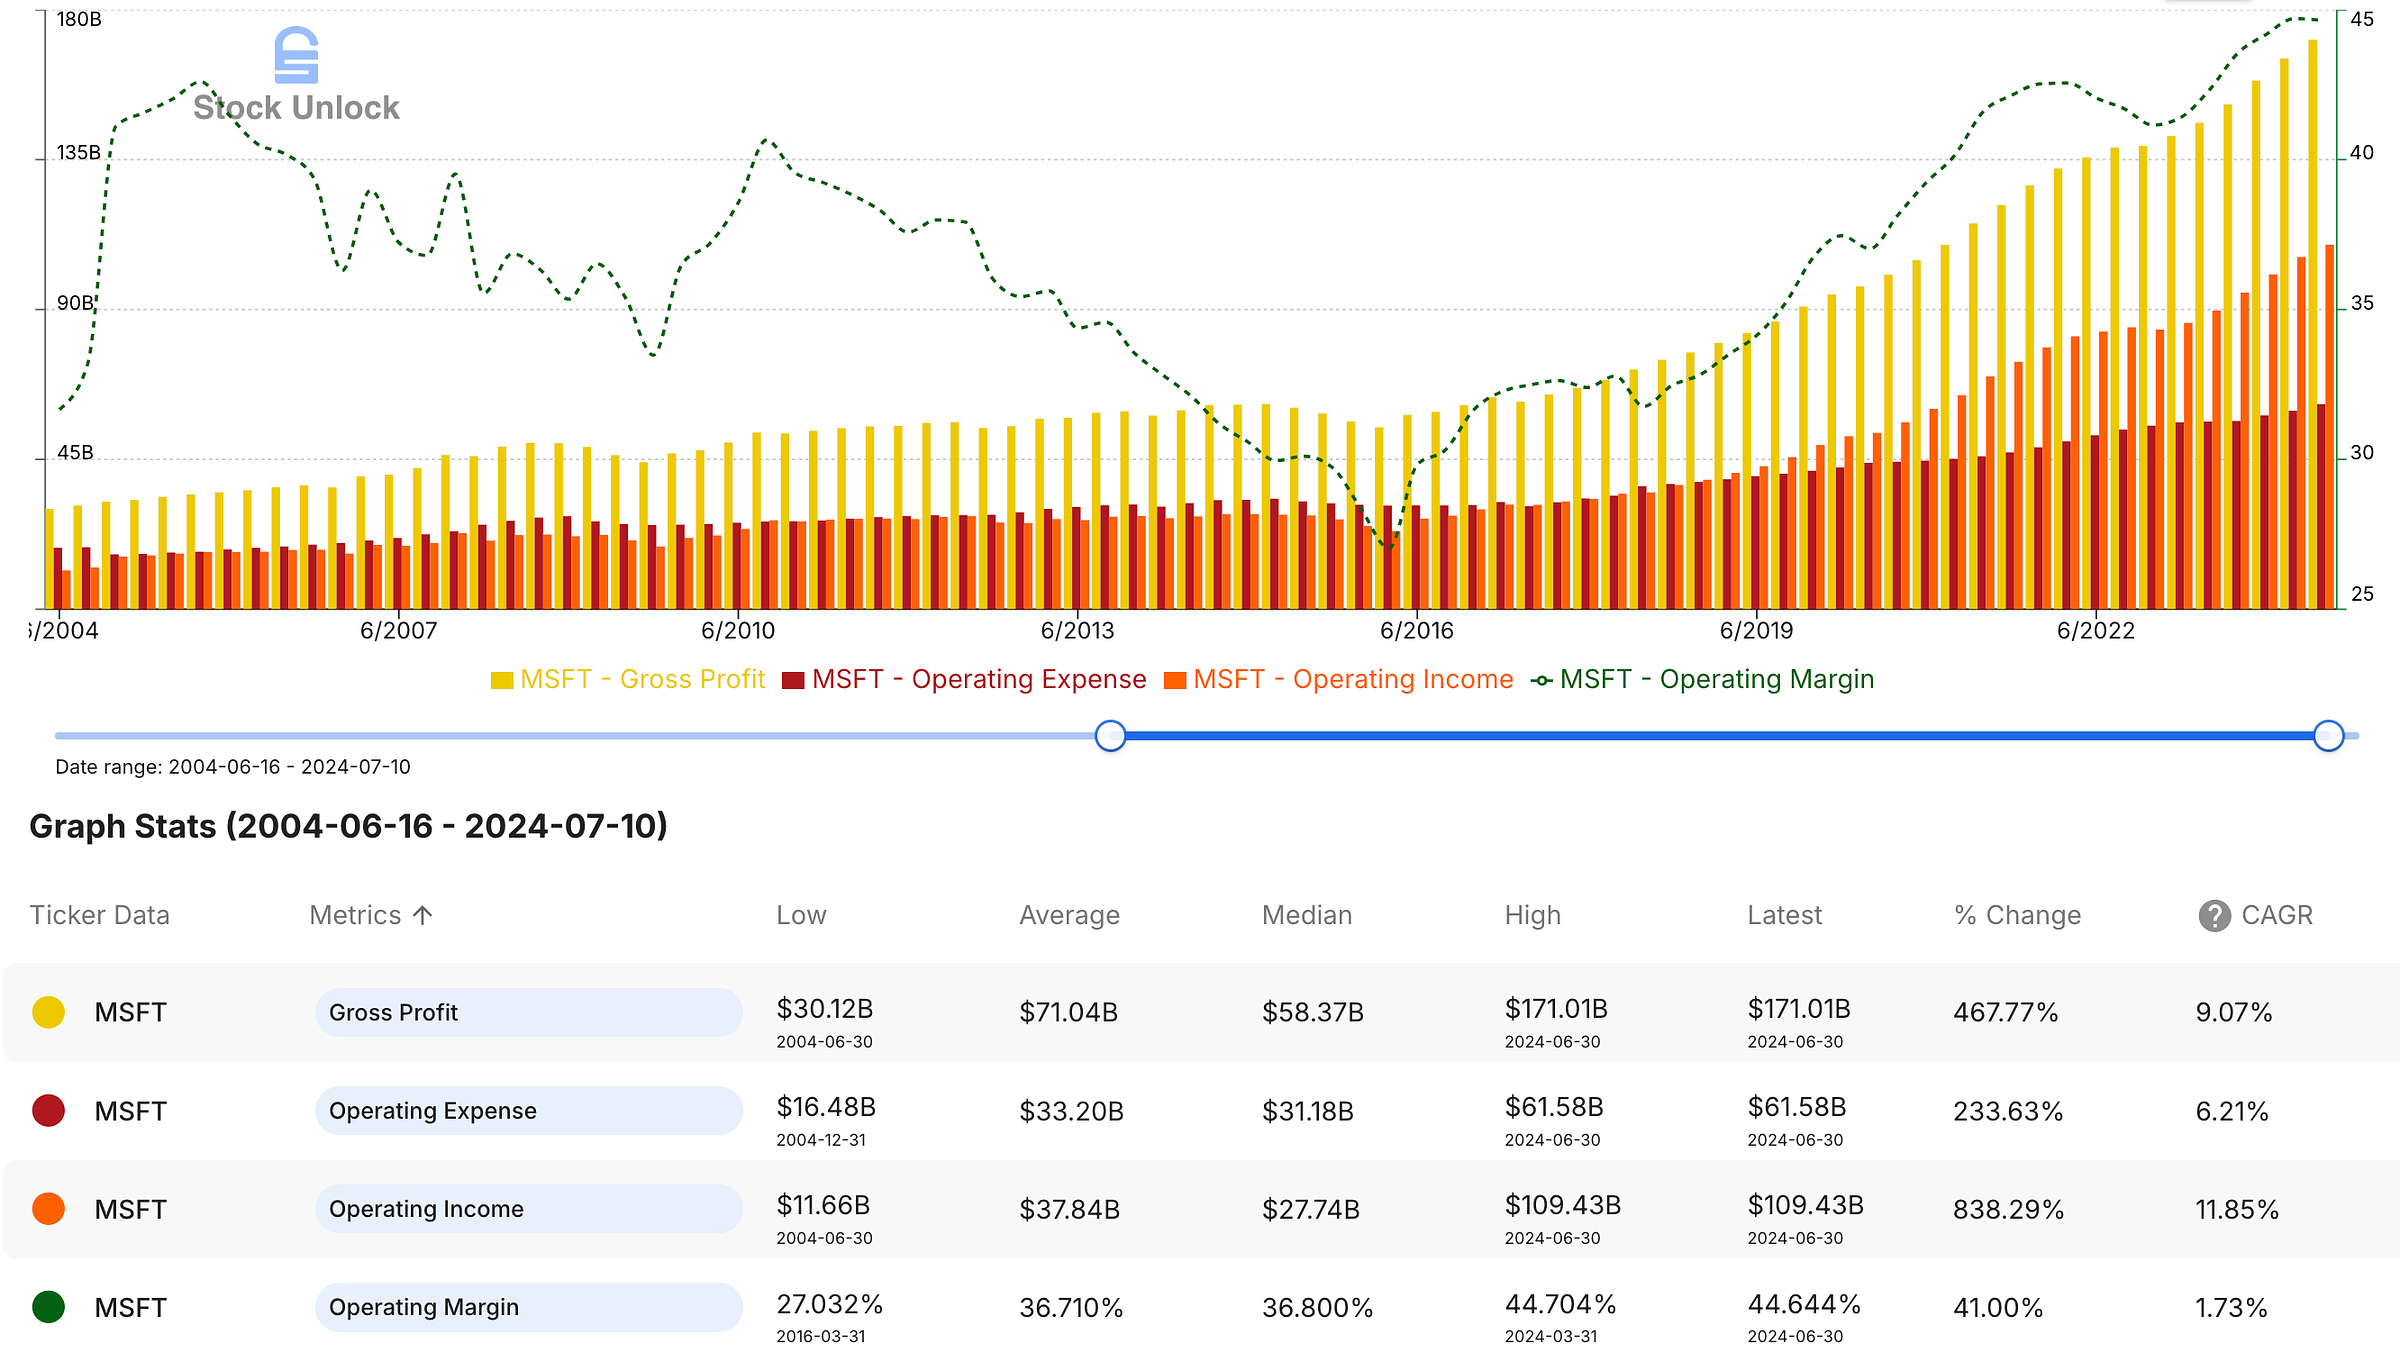
Over the 20-year period 2004-2024, Microsoft’s financial performance demonstrates a raising trend in gross profit, operating expenses, operating income, and operating margin. Microsoft’s gross profit grew at a compound annual growth rate (CAGR) of 9.07%, outpacing the growth in operating expenses, which had a slower CAGR of 6.21%. This disparity between the growth rates of gross profit and operating expenses allowed Microsoft’s operating margins to expand, with an increase of 1.73% annually. As a result, Microsoft’s operating income grew at a strong CAGR of 11.85%, faster than both gross profit and operating expenses.
This trend is beneficial for Microsoft, as it demonstrates that the company is increasingly efficient at converting revenue into profit. By keeping the growth of operating expenses in check relative to gross profit, Microsoft has been able to improve its operating margin, meaning it retains a higher percentage of each dollar earned as profit from core operations. Expanding operating margins reflect better cost control and operational efficiency, which increase profitability. For me this signifies a resilient business model capable of generating substantial returns even as the company scales, making Microsoft attractive on a fundamental basis.
Microsoft’s operational efficiency over the past two decades can be summarized by the contrasting trends of a contracting gross margin and an expanding operating margin.
Red Flags in Operating Expenses and Operating Income
Certain red flags in operating expenses and operating income may signal deeper issues that could impact profitability and long-term growth.
One red flag in operating expenses is rapidly increasing SG&A costs without a corresponding increase in revenue or gross profit. A surge in these costs can indicate poor cost management, over-staffing, or excessive spending on administrative overhead. For instance, if a company’s marketing expenses are rising sharply but revenue remains stagnant, it may signal that the company’s sales strategies are ineffective. Similarly, high growth in salaries and administrative expenses without productivity gains may suggest inefficiencies that erode profitability.
Excessive or volatile R&D spending can also be a red flag, especially if it isn’t translating into new products, innovations, or competitive advantages. While research and development are vital for growth, erratic R&D costs may reflect poorly managed projects or a lack of focus in innovation efforts. For example, a company that continuously spends heavily on R&D without clear, marketable outputs may be struggling with strategic direction or facing challenges in commercializing its innovations. I look for a steady or thoughtfully increasing R&D budget that aligns with the company’s growth objectives.
Non-cash expenses like depreciation, amortization, and stock-based compensation (SBC) can reveal potential red flags when they are disproportionately high or increasing. While these expenses don’t immediately impact cash flow, unusually high SBC, for example, indicates that a company is overly dependent on issuing equity to attract talent, diluting its shareholder in the process unless it’s offset by share buybacks. Excessive depreciation and amortization expenses may suggest that the company is heavily reliant on aging assets or that it acquired costly intangible assets, which might not yield sufficient returns.
Declining or inconsistent operating income is often a sign of operational inefficiencies or rising costs that the company is struggling to control. If operating income is shrinking while revenue is growing, it could mean that the company’s cost structure is unsustainable, and it is spending too much to support its revenue growth or it may result from increased competition and pricing pressure. This situation could lead to losses if costs continue to outpace revenue. I am cautious when I see persistent contraction in operating margin, as it could signal that the business model is becoming less profitable or that the company is losing its competitive edge.
Finally, inconsistent or unusually high one-time charges in operating expenses, such as restructuring costs, legal fees, and write-downs, can indicate underlying issues. While occasional one-time expenses are normal, frequent occurrences or high amounts can imply that the company faces recurring problems, such as legal disputes, failed investments, or inefficient restructuring efforts. These costs reduce operating income and can signal instability in core operations.
By examining these red flags in operating expenses and operating income, level-headed investors can gain a deeper understanding of a company’s operational health, cost management, and profitability challenges.
Conclusion
The income statement provides a powerful lens through which to view a company’s financial health, offering insights into revenue generation, cost management, and operating efficiency. Examining key metrics like gross margin and operating margin allows investors to understand how well a company balances growth with cost control and profitability. Over time, trends in these metrics can reveal shifts in a company’s strategic focus, as well as its ability to manage costs in response to market demands or operational changes in the past and today.
In this analysis, we explored the essential components of the income statement and highlighted red flags that may signal potential challenges in areas such as revenue, COGS, and operating expenses. These insights equip level-headed investors with the tools to evaluate a company’s financial performance and operational resilience. In another article, I delve into the remaining line items, including interest expenses, and tax obligations, to uncover how these impact a company’s bottom line and overall profitability.
By taking a comprehensive approach to income statement analysis, level-headed investors can make more informed decisions and better anticipate potential risks and opportunities.
Channel stuffing is a sales practice where a company pushes more products into its distribution channels than the end customers are likely to purchase. This artificially inflates revenue in the short term as more inventory is sold to distributors, but it often leads to lower sales in future periods as distributors work through the excess inventory.
Bill and hold is a revenue recognition method where a company records revenue on products that have been sold but not yet delivered to the customer. The customer agrees to the billing in advance, but the company holds the inventory until delivery. While legitimate under certain circumstances, it can be abused to prematurely recognize revenue, giving a misleading impression of higher sales and profitability.


